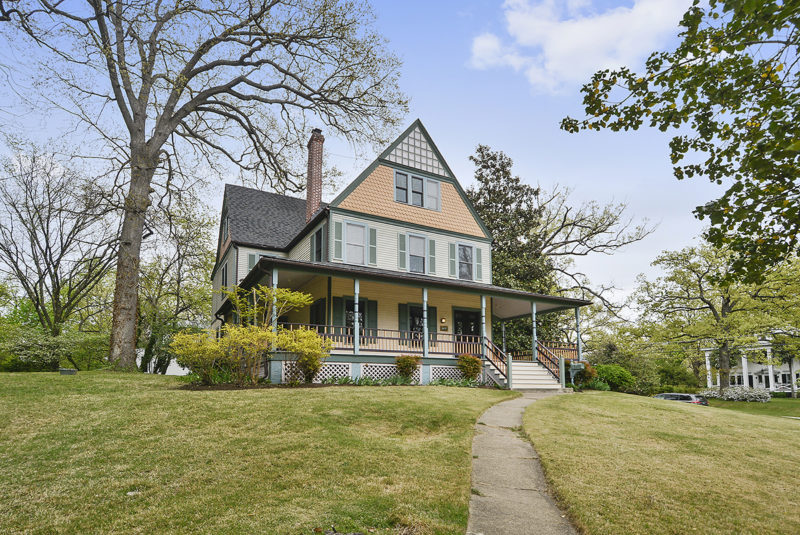
Below are data statistics for single-family home sales year to date in 20910, 20901, 20912, and 20895.
Interested in what’s happening in another zip code or are you looking for information on the market in your specific neighborhood? Contact us for local market insights.
[wolf_col_6 class=”first”]

[/wolf_col_6]
[wolf_col_6 class=”last”]
73 Homes Sold in 20910
Highest Priced Sale – $1,213,990
Average Home Sold Price – $637,453
Average Days on Market – 22
[/wolf_col_6]
[wolf_col_6 class=”first”]

[/wolf_col_6]
[wolf_col_6 class=”last”]
136 Homes Sold in 20901
Highest Priced Sale – $805,334
Average Home Sold Price – $471,015
Average Days on Market – 29
[/wolf_col_6]
[wolf_col_6 class=”first”]

[/wolf_col_6]
[wolf_col_6 class=”last”]
46 Homes Sold in 20912
Highest Priced Sale – $1,050,000
Average Home Sold Price – $536,202
Average Days on Market – 28
[/wolf_col_6]
[wolf_col_6 class=”first”]

[/wolf_col_6]
[wolf_col_6 class=”last”]
110 Homes Sold in 20895
Highest Priced Sale – $1,575,000
Average Home Sold Price – $623,168
Average Days on Market – 32
[/wolf_col_6]
Want more insights from Go Brent Team? Sign up for our newsletter below.
* indicates required Email Address *
First Name
Last Name

